Quick answer: Most food carts break even in 3–9 months. The range is wide because payback depends on three numbers you control: total invested capital ($4,000–$15,000 landed), daily gross profit ($80–$600), and trading days per month (12–26). A coffee cart at $6,500 invested earning $180/day gross profit over 20 trading days recovers in about 2 months of trading; a fully fitted street-food cart at $12,000 earning $350/day recovers in roughly 2 months at full volume — but real-world ramp-up, seasonality and bad-weather days stretch both figures to the 3–9 month band. This guide shows the exact math so you can run your own numbers before you order.
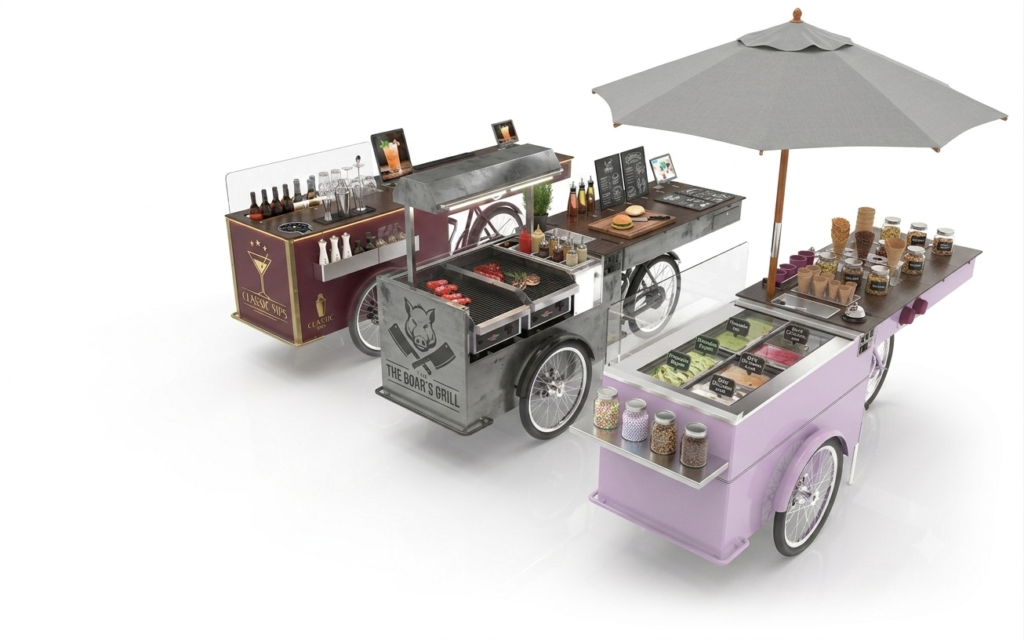
This guide is part of our Business & Profit series from the export floor at MAG-STAR CHEF, built from reported results of operators in 30+ countries. Pair it with the full cost breakdown, the 8-step launch guide, and the equipment buyer’s guide.
The ROI Formula Every Cart Operator Should Memorize
Break-even time in months is:
Payback (months) = Total Invested Capital ÷ (Daily Gross Profit × Trading Days per Month)
Where Daily Gross Profit = daily revenue − cost of goods sold (food, packaging, fuel/energy, pitch fees) — before your own labor and before fixed overheads like insurance and commissary. Keep the three inputs honest and the formula is brutally accurate; fudge any of them and the payback fantasy begins. The most common distortion is counting revenue at full mature volume from day one — real carts ramp over 4–8 weeks as regulars accumulate. Model month one at 50–60% of target volume and month two at 80%, then full volume from month three.
Startup Cost Baseline: What You Actually Invest
The invested-capital number is where most calculations fall apart, because buyers count the cart and forget the landing. A complete first-year investment looks like this:
| Line Item | Typical Range | Notes |
|---|---|---|
| Cart, fitted (FOB) | $2,500–$8,500 | See the price guide by cart type |
| Sea freight + import duty | 15–30% of FOB | Varies by country and HS code |
| Permits & licenses | $100–$2,000 | Mobile vending + food handler |
| Commissary deposit | $100–$400/mo | Required in many jurisdictions |
| Initial inventory | $300–$800 | 3 days of stock at launch |
| Branding & signage extras | $0–$500 | $0 if factory-applied |
| Contingency (10%) | — | Non-negotiable |
Realistic all-in landed figures: $4,000–$6,000 for a lean cold-display or single-stove build, $6,000–$10,000 for a double-stove hot-food cart, $10,000–$15,000 for premium multi-zone builds.
Revenue Scenarios by Business Model
| Model | Avg Ticket | Sales/Day (mature) | Revenue/Day | Gross Profit/Day |
|---|---|---|---|---|
| Coffee & hot drinks | $4–$6 | 40–80 | $160–$480 | $110–$340 |
| Ice cream / gelato | $4–$7 | 60–150 | $240–$1,050 | $160–$700 |
| Burgers & street food | $8–$13 | 25–60 | $200–$780 | $120–$470 |
| Waffles & desserts | $5–$8 | 30–70 | $150–$560 | $100–$390 |
| Event catering (per event) | $1,500–$3,000 | 4–10 events/mo | — | $900–$2,000/event |
Food-cost ratios run 25–35% for coffee and desserts, 30–38% for hot food. Ice cream wins on margin; burgers win on ticket size; events win on absolute profit per day. The platform choice follows the model — our Pozzetti cart targets the margin play, the double-stove cart targets the ticket play, and the base cart targets the event-flexibility play.
Operating Costs That Eat the Margin
Gross profit is not take-home. The recurring monthly deductions to model:
- Pitch fees & permits — $0 (own pitch) to $500–$1,500/month (premium city spots). This line varies more than any other and often decides between locations.
- Commissary — $100–$400/month where required.
- Insurance — $50–$150/month for general liability; product liability adds more for dairy menus.
- Energy & fuel — $20–$80/month (see the electric vs gas comparison for the full math).
- Maintenance — under $200/year on a factory-fitted cart; budget it anyway.
- Waste, packaging, card fees — 3–6% of revenue combined.
A realistic net margin after all operating costs but before owner labor: 25–45% of revenue for well-run carts in good pitches. If your modeled net margin is below 20%, the pitch or the menu is wrong — fix the model before buying the cart.
Break-Even Timelines: Four Worked Examples
| Scenario | Invested | GP/Day | Days/Mo | Payback |
|---|---|---|---|---|
| Coffee cart, office district | $6,500 | $180 | 20 | 1.8 mo |
| Gelato cart, tourist promenade (6-mo season) | $9,500 | $450 | 22 | 1.0 season |
| Double-stove burgers, weekend markets | $11,000 | $320 | 10 | 3.4 mo |
| Event catering cart | $13,000 | $1,400/event | 5 events | 1.9 mo of events |
Apply the ramp-up reality (50% month one, 80% month two) and add a 15% bad-weather allowance, and these book figures become the honest 3–9 month band from the quick answer. Print your own version of this table with your city’s numbers — it is the single most useful document in a cart business plan, and it doubles as the appendix for any quote request so the builder can spec the cart to your real budget.
What Moves Payback the Most: A Sensitivity Check
Not all improvements are equal. Ranked by impact on payback time:
- Trading days per month — going from 12 to 20 days nearly halves payback. Consistency beats intensity; a mediocre pitch worked daily outperforms a great pitch worked weekends.
- Gross margin per ticket — a $1 menu-price increase on 40 sales adds $1,200/month at the same volume. Menu engineering is free.
- Capital discipline — every $1,000 saved on the build (factory-fit vs retrofit, right-sized battery) shortens payback proportionally. Buy the spec you need, not the spec that impresses.
- Upsell attachment — drinks or toppings attached to 40% of orders lift revenue 15–25% with zero capital cost.
- Weather/season mitigation — a winter rotation (hot drinks on the same cart) converts a 6-month asset into a 12-month one; see the ice cream cart guide winter strategy section.
Six Levers to Shorten Break-Even
- Pre-sell before launch — office blocks, event planners and hotels contacted during the 4-week production window become week-one revenue.
- Factory-fit everything — retrofits cost 30–60% more than factory options and delay launch for inspections.
- Cash-only early pitch list — in some markets card fees and hardware can wait a month; know your local payment norms.
- Share a pitch — split a premium spot’s fee with a complementary non-competing cart (coffee + hot food) and both paybacks improve.
- Track by day, not by week — daily per-pitch revenue data finds the 70/30 concentration within a month; weekly data finds it too late.
- Reinvest month 3-5 profit into a second unit — fleet operators reach break-even on capital faster than single-unit owners because commissary, storage and branding costs are shared.
Financing the First Cart
Where the capital comes from matters less than its cost. In rough order of preference: savings (zero cost), equipment financing from the builder or local lender (5–15% APR, often secured by the cart itself), microloans and small-business programs (the US SBA microloan program caps at $50,000 and suits cart-scale projects), family capital with written terms, and revenue-share arrangements with event venues. Avoid high-interest consumer debt against an asset with seasonal revenue — a 24% APR loan can turn a 4-month payback into a 9-month one and erase the model’s buffer. Many of our buyers stage the investment: order the base cart and one appliance now, add the second station from trading profits in month four — the platform is designed for that path.
Case Study Snapshots from Three Markets
Three anonymized operator reports illustrate the model in the wild. A Riyadh coffee-cart buyer invested $8,200 landed on a battery base cart with an espresso fit-out and a premium wrap, contracted two office towers during the production window, and booked $2,100 revenue in week one — payback in 11 weeks, faster than model because the pitch was pre-sold. A Barcelona gelato operator with a Pozzetti cart at $10,400 landed ran a 7-month promenade season at $380–$520 gross profit per day, recovered the full investment inside season one, and spends winters on hot-chocolate and churros rotation at 40% of summer volume — the winter plan is what made the annual math work. A Texas double-stove buyer at $12,800 landed targeting weekend farmers markets hit only 8 trading days a month for the first quarter and took 7 months to break even — exactly the days-per-month sensitivity the table above predicted. The pattern across all three: the model was accurate, the inputs were the variable.
Risks That Break the Model (and Their Hedges)
Every payback model assumes continuity, and three risks interrupt it most often. Pitch loss — the city re-tenders your spot or a landlord changes terms; hedge by holding two approved pitches and a relationship with the local vending office before you need them. Regulatory drift — a new health rule adds equipment or paperwork mid-season; hedge by buying factory-fitted to recognized codes (CE, FDA Food Code baseline) so updates are incremental, and by following the compliance sections in our launch guide. Demand shock — roadworks kill foot traffic, weather wrecks a month; hedge with the 10% contingency, an event-catering fallback, and a menu that rotates indoors (malls and food halls are weather-proof). Operators who wrote a one-page risk register before ordering consistently reported calmer first years — the model survives contact with reality only if you name what can bend it.
A final word on labor, the input the formula deliberately excludes. Owner-operated carts measure payback on capital because the owner is paid in profits; the moment you hire staff, the model must add wages at roughly $15–$25 per trading hour and payback stretches by 2–6 months depending on coverage. That is not a reason to avoid hiring — it is a reason to know which model you are running: a owner-operator lifestyle business, or a staffed operation building a saleable asset. Both are legitimate; only one of them shows payback in a single quarter.
Frequently Asked Questions
How profitable is a food cart business?
Well-run carts net 25–45% of revenue after operating costs and before owner labor. On $500–$1,000 revenue days that is $125–$450 net per trading day; annualized for a 200-day operator, $25,000–$90,000 before tax.
How long does it take to break even on a food cart?
3–9 months is the realistic band: 1–3 months for lean coffee or dessert carts at consistent volume, 4–9 for hot-food builds, or one season for tourist-pitch ice cream with a winter rotation plan.
What daily sales does a cart need to be viable?
Divide your all-in investment by 90 (targeting a 3-month recovery) to get the required daily gross profit, then divide by your gross margin per sale. A $7,000 build at $4 GP/sale needs about 20 sales a day — a very achievable bar for a decent pitch.
Is a food cart more profitable than a food truck?
Per dollar invested, usually yes: the cart’s capital is one-third to one-tenth of a truck’s and permits are simpler, so ROI percentage favors carts strongly. Absolute revenue favors trucks where vehicle-scale volume exists — see the full comparison.
What is the biggest mistake in cart ROI planning?
Modeling mature volume from day one and ignoring the landing costs. Add the ramp-up curve, the freight and duty, permits and a 10% contingency — then the payback math survives contact with reality.
Written by Mike, export sales lead at MAG-STAR CHEF. Send your city, pitch plan and budget via the quote desk and we will return an itemized quote plus a payback model for your scenario (WhatsApp +86 137 5771 7214).